

Charts Cloud, our browser based chart viewer, and Charts Android, the app for Android tablets, are now out the door and in the process of being beta tested by a team of invited hardcore and tenacious simmers. Using TestFairy reports and automated log data are trickling in to our office and one by one we are exterminating the final bugs. The Android app just passed 1,000 logged beta testing sessions over a total of 122 man hours.
We are really pleased with our initial design decision to make significant parts of the applications web-based. Everything related to the enroute charts is shared across all platforms which means that if enroute charts pass testing on one platform, they should be good to go on all platforms.
Furthermore, those of you familiar with software development might know that our applications are based on an API (Application Programming Interface). This API is also located on the web and once tested for one platform, it is fair to assume that it will behave quite similarly on all other platforms. Once we get it working on one platform, it’s quite straight forward to implement the same sequence of calls on other platforms.
This means that we don’t foresee that we will need much time to test the iOS and Desktop versions. In other words, we should be ready for release “quite soon”.
As we hope you have noticed, we really like when our users talk to us and provide feedback and comments. In all honesty, this is the only way for us have any sort of clue on how to evolve and develop the software you guys want. The challenge for us is to listen to all of you at the same time. Therefore, logging is really useful for us and we hope that you don’t mind us looking at your behavior to learn what’s going on in our apps.
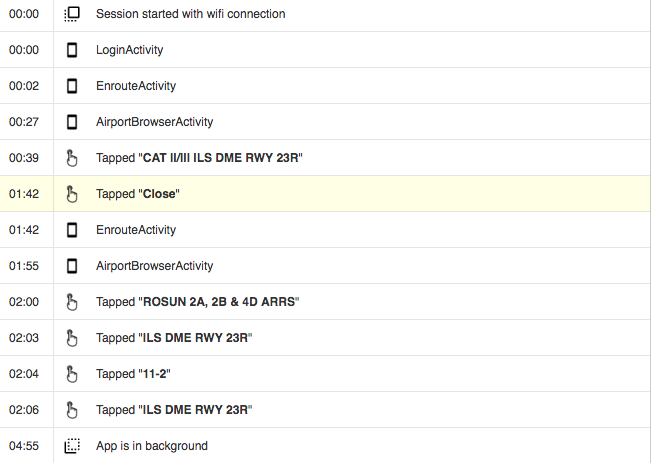
Here is an example of a typical user. He (or she) logs in, passes the enroute interface to go to the airport interface and then studies the ILS for RWY 23R for a few minutes before returning to the simulator.
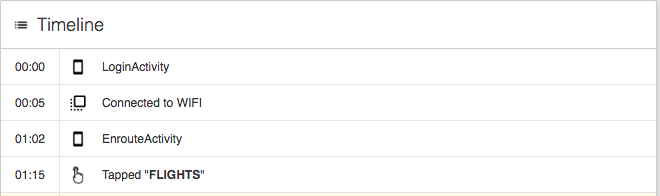
Here is a user whose app wouldn’t automatically log in again. Obviously the user wouldn’t know why. However, for us it is clear to see that the reason is that the WiFi was not active during login. The app connected to WiFi only five seconds after it attempted to log in. This gave us an opportunity to adjust the code to wait for WiFi connection.
A big challenge for us is also the varying resolutions and sizes of the interface on the various devices being used. Here is an example of what the login screen on the Android device looks like for a couple of different users.
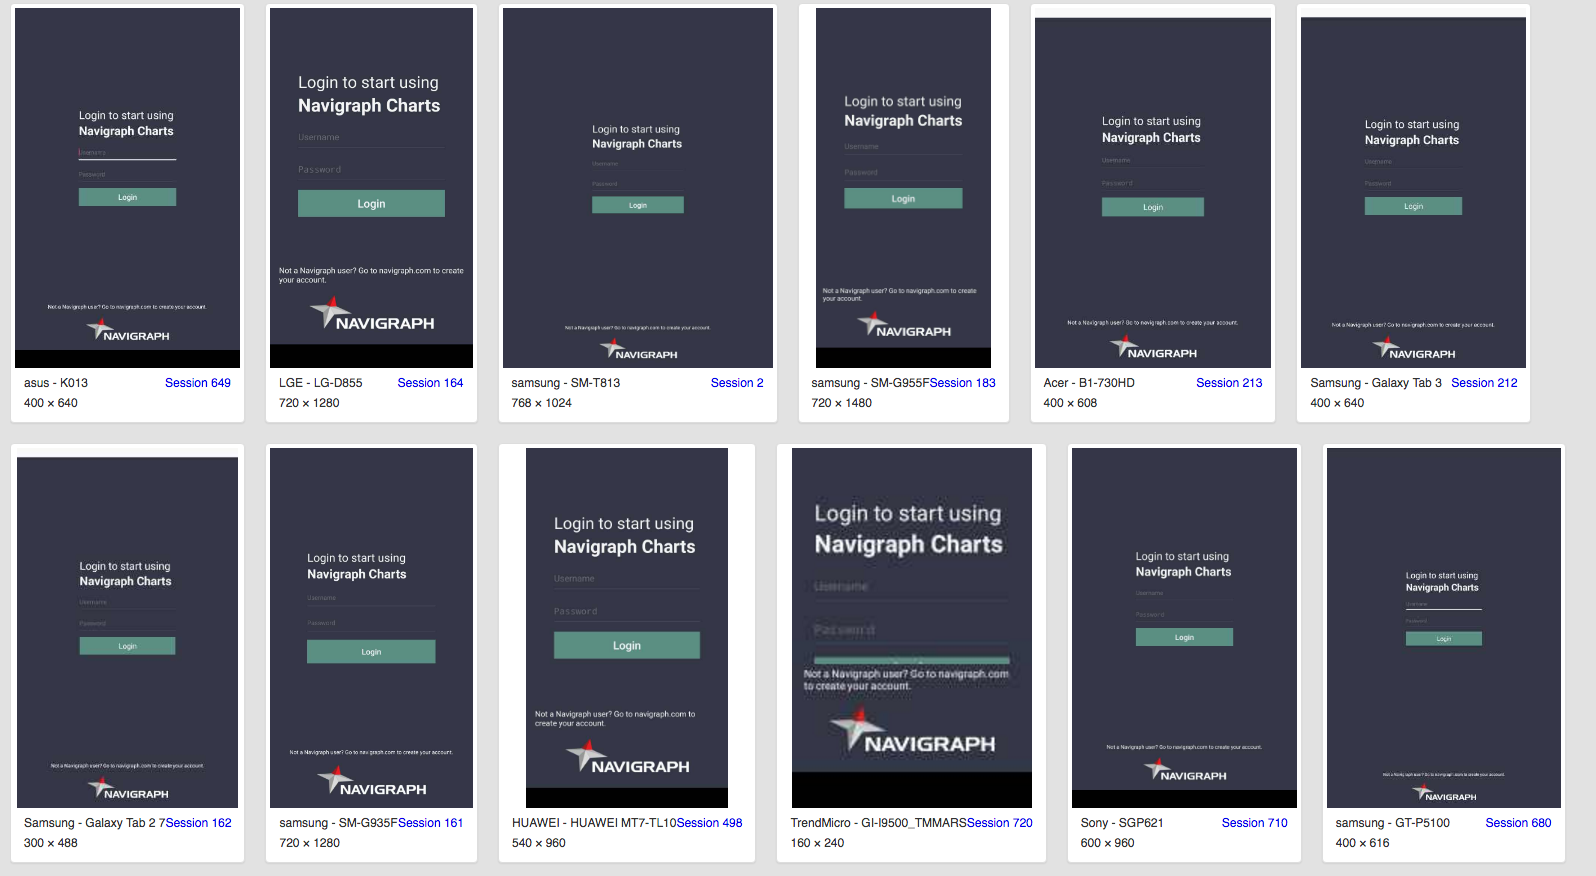
We don’t want to point any fingers, but the user who attempted to view charts on a phone with 160 by 240 pixel resolution may want to consider getting a bigger screen. ;)
But how do we connect informations in the log with what’s going on in the visual interface? Well, we actually video record every beta tester session. This is what it looks like when a user selects a chart by pressing on the screen (denoted as a yellow filled circle).
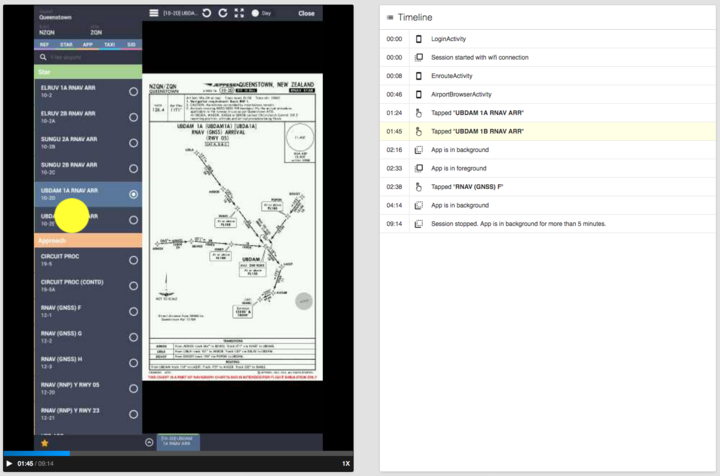
It should be stressed that only beta users are being recorded like this. The final released version of the software does not have these extensive logging and recording functions enabled. We also want to say that we only observe the Navigraph app. If the app is left idle for more than 5 minutes, the logging automatically stops. In fact, this testing procedure generates so much data that we only look at the sessions where the user reports a bug to backtrack what actually happened.
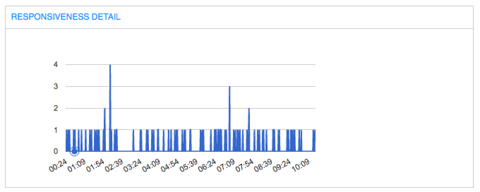
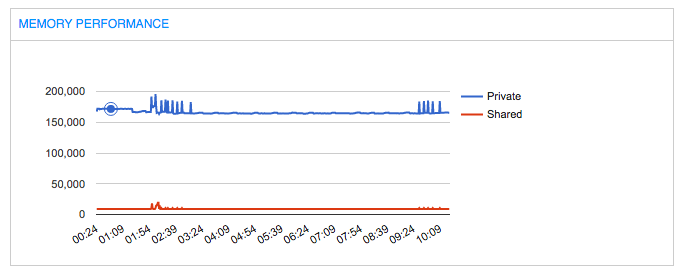
When we do get a bug report we also have the possibility to have a look at the memory usage and responsiveness of your device making sure we don’t hog too much or your resources. In the second graph below we can also catch any memory leaks. The peaks are memory allocated and returned for airport charts being opened and closed.
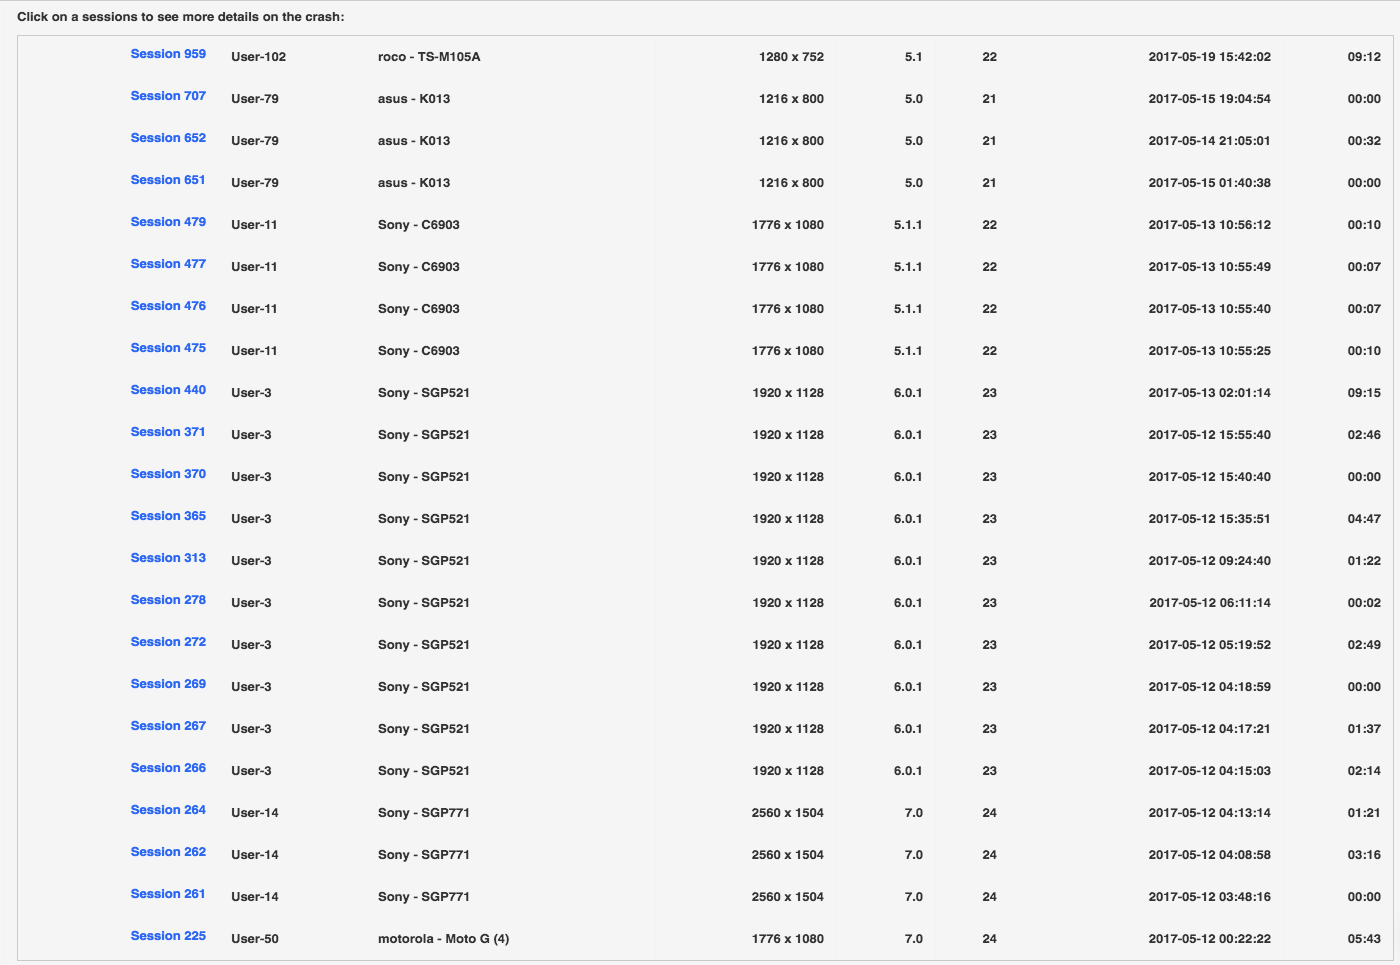
Despite extensive internal testing in some rare cases the app crashes completely. Luckily, only 11 users have experienced a crash. The logs quickly reveal that there was something peculiar with Sony devices which we needed to take a closer look at.
When the beta test period is over we will only keep a minimum of logging functions active to see the health of our systems. The most obvious data that you will be sharing with us at this point is the position reports of your airplane using the Simlink software (which has an off and on switch). Simlink is used for the moving maps function, but sends your position data on a “detour” up to our servers on its way from your simulator down to any Chart software you are running. We did not do this intentionally to spy on you, but to simplify network setup. However, we do take this opportunity to draw your position on a world map here in office to see what’s going on in the virtual world. Below you can see two beta test users flying this Saturday afternoon. After release we expect this screen to be covered with flights.
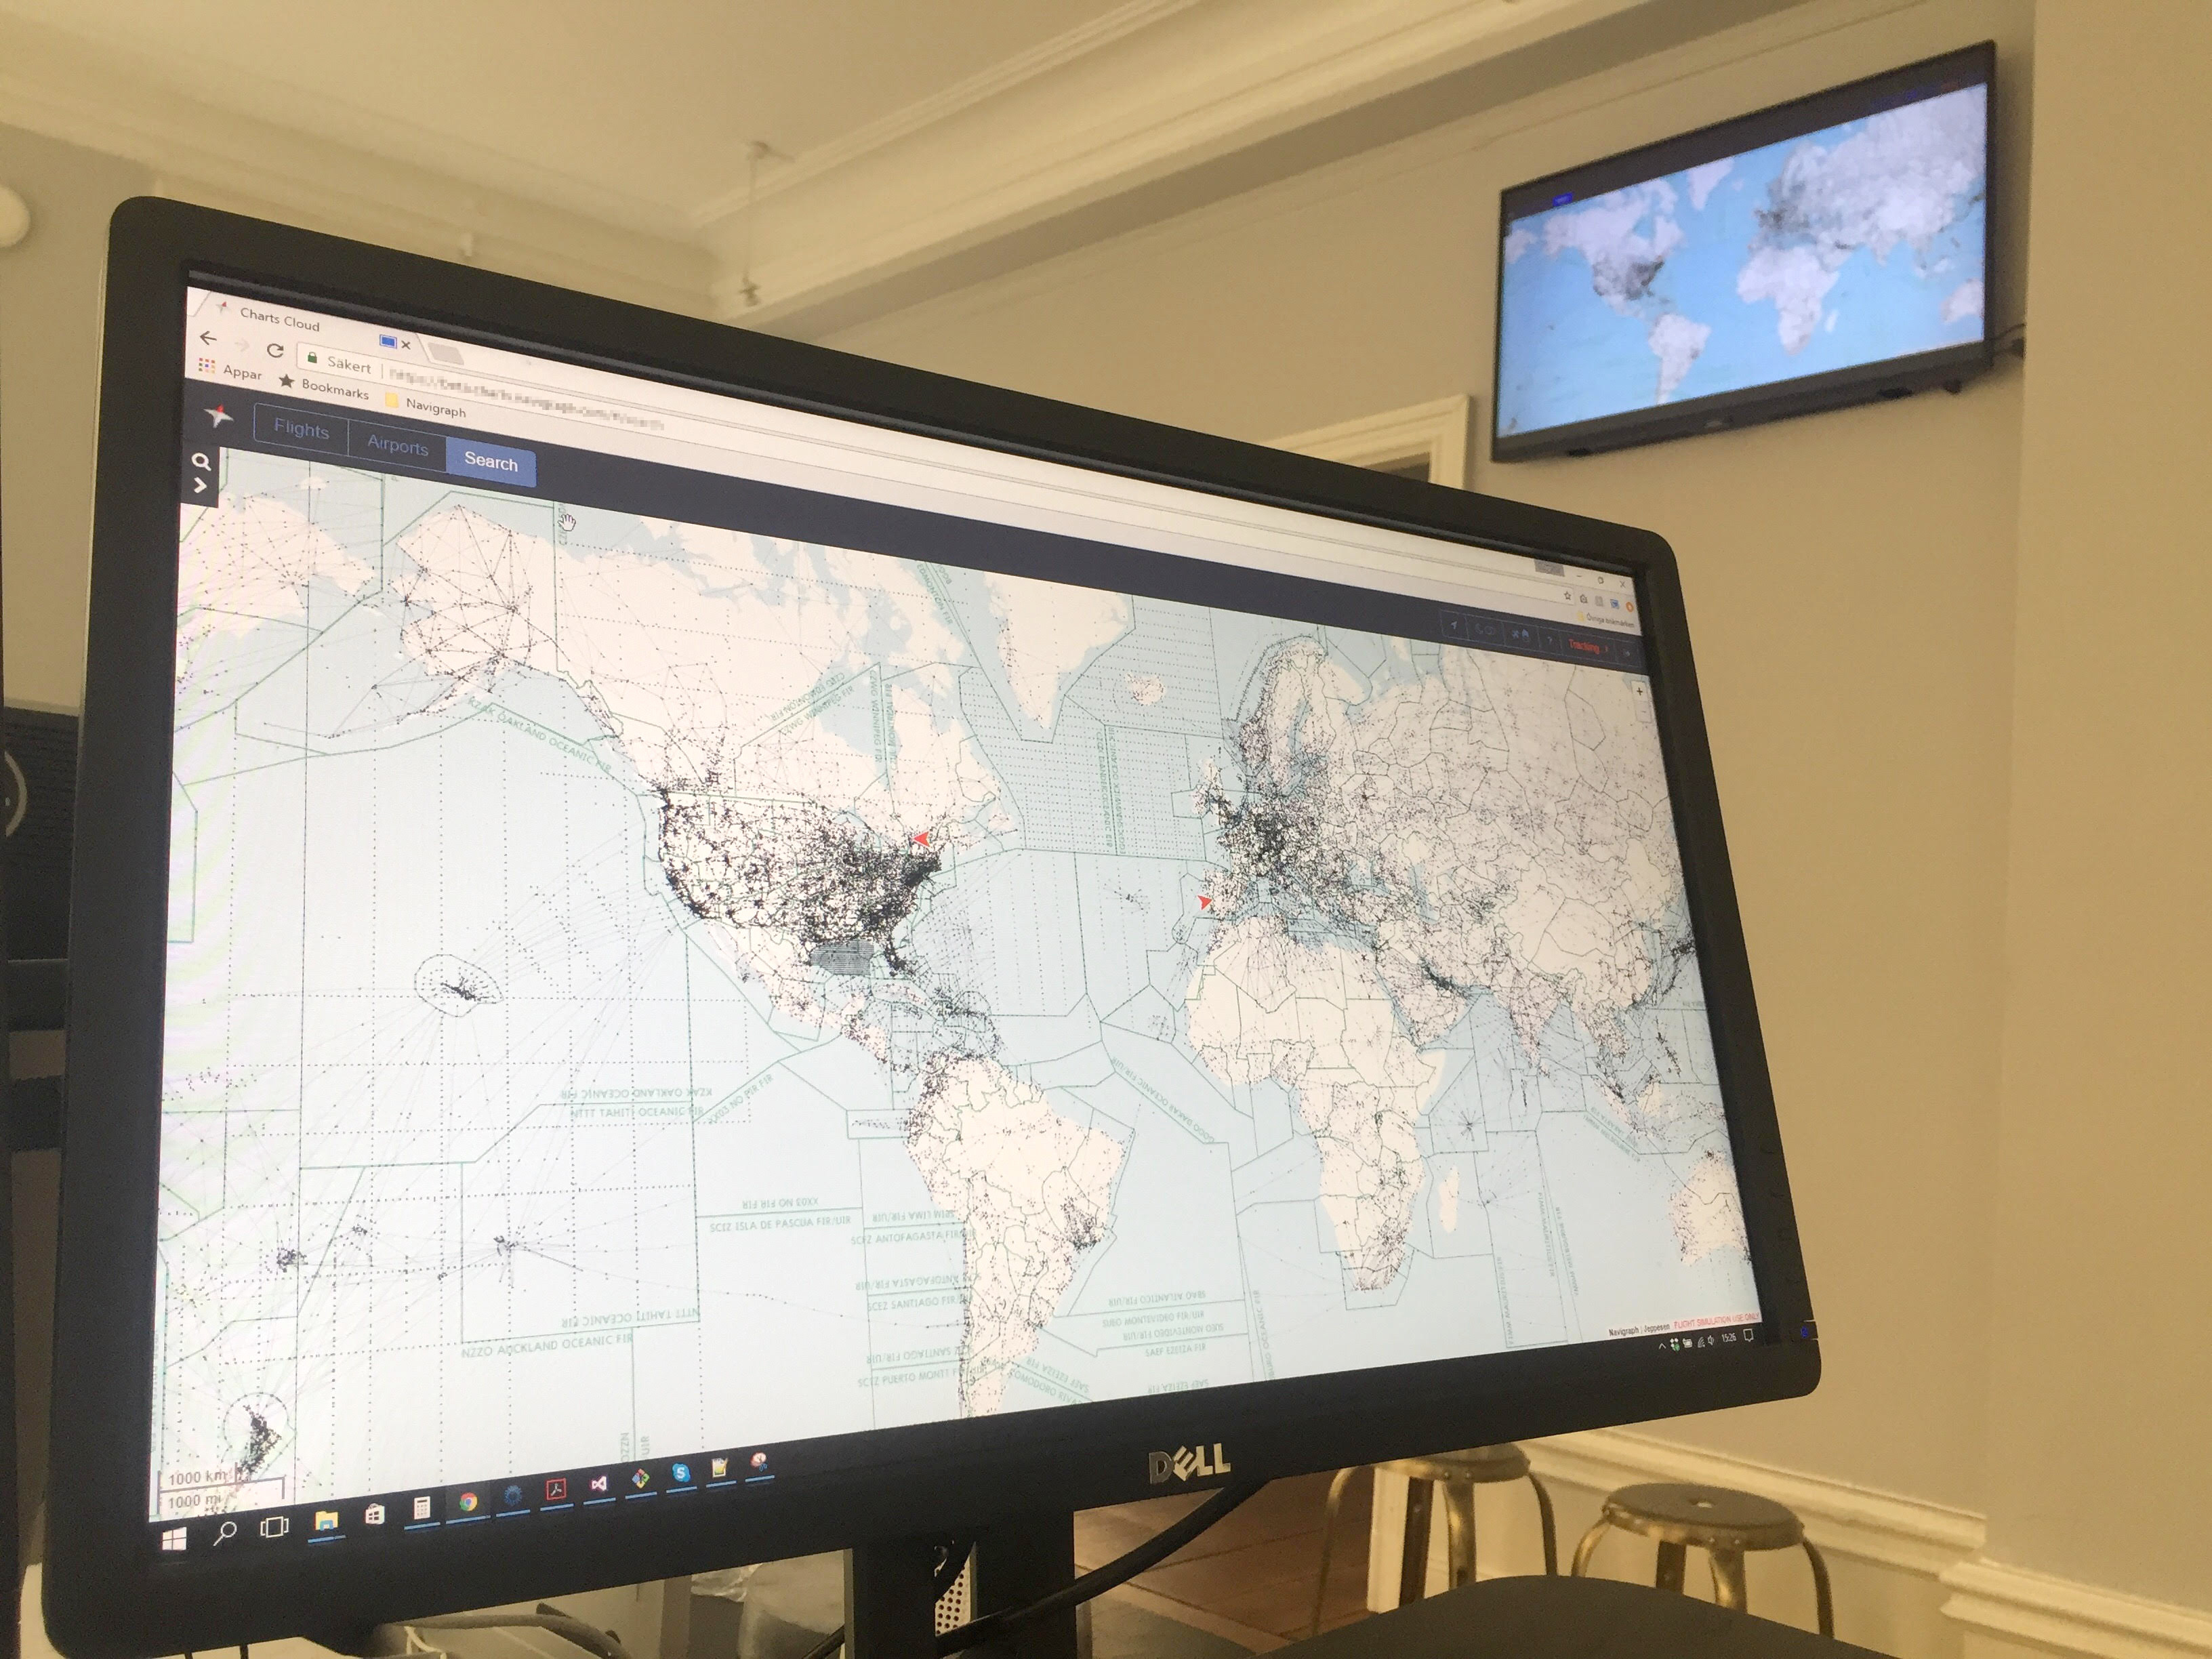
Remember that we really appreciate your thoughts and feedback? Well, here is another opportunity for you - can we use this world map for something fun or useful? A virtual radar? A chat client? Virtual communication? Let us know - either in the comments field here on the blog, on social media, or via dev@navigraph.com.