

The Navigraph FlightSim Community Survey 2017 conducted between 20th October and 6th of November has now been compiled and partially analyzed. This year 3,187 respondents participated, which is an improvement over last year’s 2,200 participants.
This blog posts highlights some interesting and notable observations in the survey. What’s interesting and notable depends on the reader, but in general we can say that the average flight simmer is a 47 year old male living in the US, working full time, with an average of 16 years of flight simulation experience, flying a Lockheed Martin Prepar3D v.4, mainly out of interest, about five times a week, for a weekly average of 11.5 hours.
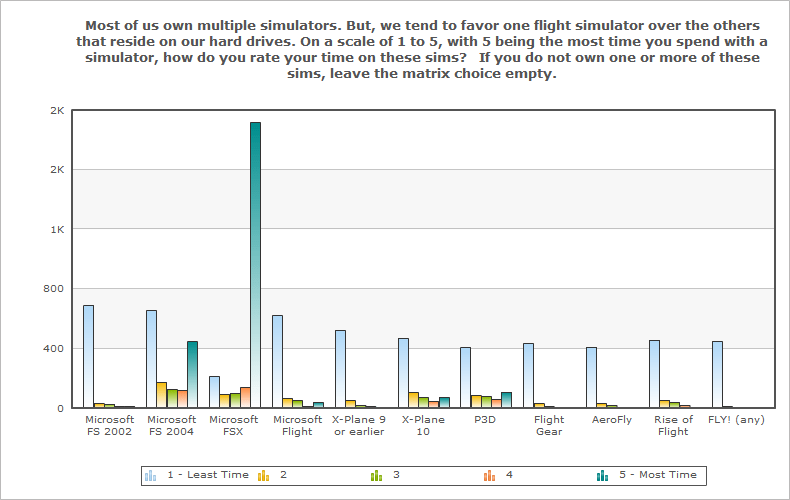
We also note that Lockheed Martin Prepar3D is now more popular than Microsoft FSX and that Laminar Research X-Plane has doubled in popularity since last year.
We at Navigraph really like surveys. It gives us a much better understanding of things that otherwise would have been, at best, educated guesses. We used the results of the 2016 survey to guide several of our development decisions. For this reason we want to thank all of you who participated. It also feels like you should gives yourselves a round of pats on the backs too, for helping to guide the future of flight simulation.
We organized this year’s survey according to the following topics:
- Demographics
- Relation to aviation
- Simulator habits
- Consumption habits
- Community
- Misc. product feedback
Here are some of the insights which we think might interest you:
Demographics
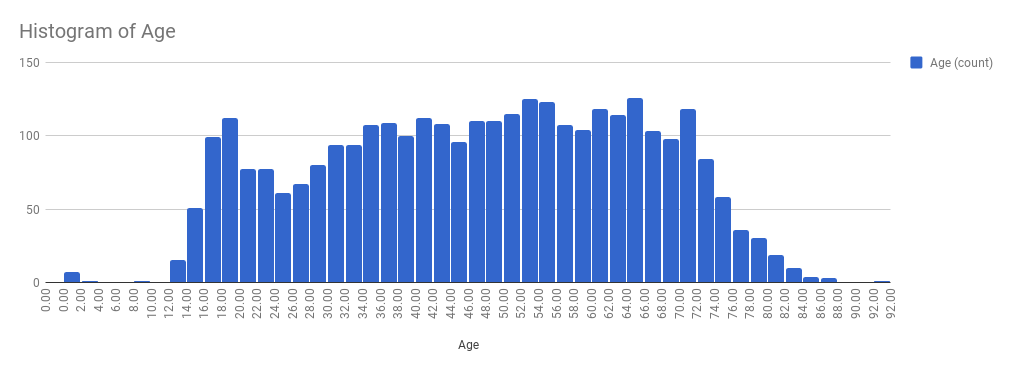
The average flight simmer has grown 3 years older on average since last year’s survey. This year your typical simmer is 47 years old, but last year he was 44. However, as seen from the histogram below, we have a younger generation coming, and a rather noticeable long tail. It seems, however, like flight simulation is not very popular during university studies.
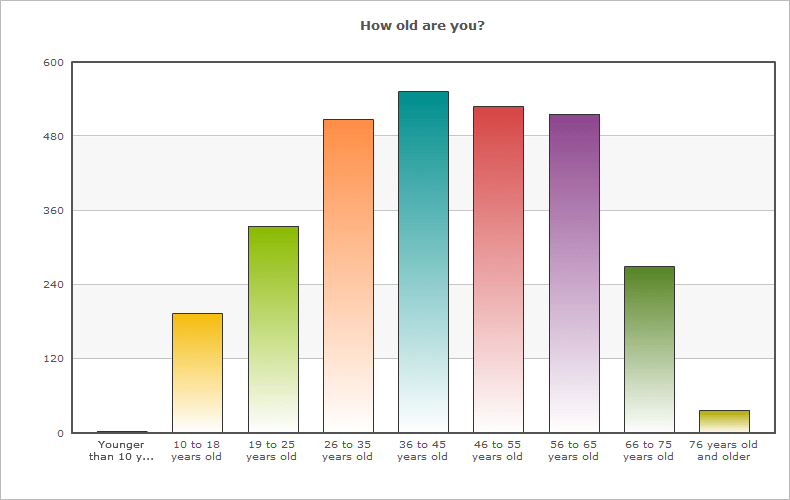
This rise and dip below 30 is not noticeable in the 2013 AVSIM survey (below).
The long tail can be confirmed in our question about employment.
- 11.67% are in school, a full or part time student
- 52.06% are employed full time
- 21.21% are retired
We thought it was interesting to see that 1 in 5 of our users are retired.
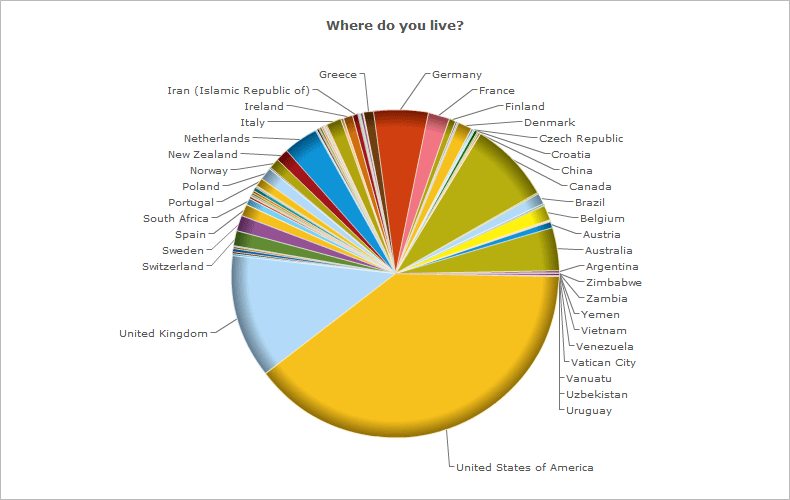
The 2017 survey respondents live in:
- United States 23.09% (13.84%)
- United Kingdom 14.21% (7.66%)
- Germany 10.83% (9.31%)
- Canada 4.86% (2.70%)
- Australia 4.68 (2.37%)
(Percentage of users from the Navigraph user database presented in parentheses.)
This distribution of countries aligns in ordinality with the 2013 AVSIM survey (below), but not in proportion. (As seen in the meta analysis section in the end of this post, there is a skew in willingness to participate in surveys depending on nationality - or language rather.)
Relation to Aviation
28.82% of the respondents answered that they do something relating to aviation such as pilot, instructor, air traffic controller, engineer, software developer, airport operations, dispatcher or cabin crew.
24.25% of the respondents have some sort of pilot license (PPL, ATPL, CPL, etc).
6.7% are currently enrolled in flight school.
Simulator Habits
For how long have people been flying? When we asked for simulator experience we discovered something rather neat. Our respondents seem to link the start of their simulator career with the launch date of a particular software. Compare this list with the histogram below (the software titles which definitely do not correlate have been stricken trough):
- Lockheed Martin Prepar3D, released in 2011, 6 years ago
Laminar Research X-Plane 9, released in 2008, 9 years ago- Microsoft Flight Simulator X, released in 2006, 11 years ago
Microsoft Flight Simulator 2004, released in 2003, 14 years ago- Microsoft Flight Simulator 2002, released in 2001, 16 years ago
Microsoft Flight Simulator 2000, released in 1999, 18 years ago- Microsoft Flight Simulator 98, released in 1997, 20 years ago
- Microsoft Flight Simulator for Windows 95, released in 1996, 21 years ago
- Microsoft Flight Simulator 5.1, released in 1995, 22 years ago
- Microsoft Flight Simulator 5.0, released in 1993, 25 years ago
Microsoft Flight Simulator 4.0, released in 1989, 28 years ago- Microsoft Flight Simulator 3.0, released in 1988, 29 years ago
- Microsoft Flight Simulator 2.0, released in 1984, 33 years ago
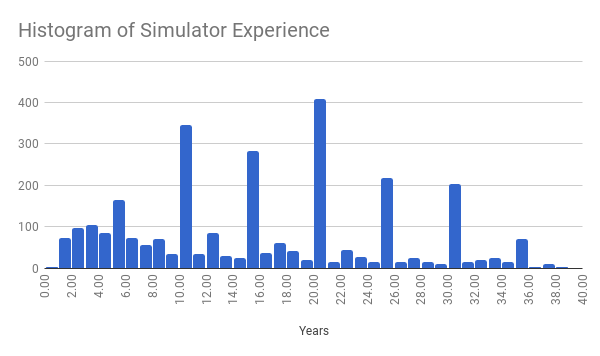
Having seen this histogram an average might not make sense, but if someone is interested it happens to be 16 years.
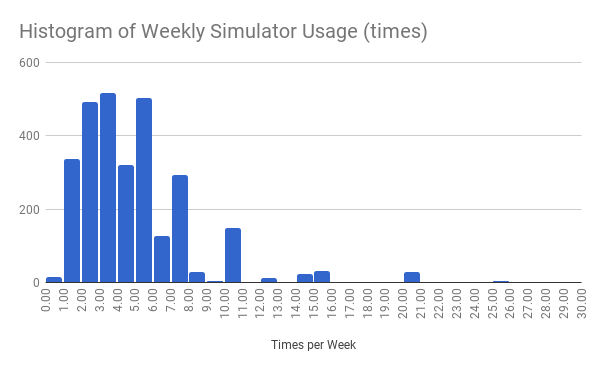
How much do people fly? We also asked how often and how much you use your flight simulator. The magic number is 5 times per week although there are some who fly as frequently as 7 or even 10 times per week.
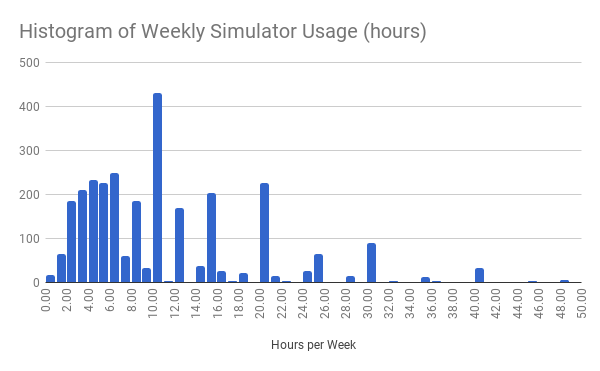
When asked how much time you spend in the simulator each week, the average is 11.5 hours. This is two hours longer than reported by the 2016 survey. (Also you can’t help but being curious about the peaks at 30 and 40 hours. Are these instructors?)
Where to people fly? London Heathrow (EGLL) was voted the most popular departure airport, as well as arrival airport, followed by Amsterdam Schipol (EHAM). Third was London Gatwick (EGKK) as departure and Frankfurt (EDDF) as arrival.
Why do people fly?
- Entertainment 37.01%
- Interest 48.06%
- Training towards a pilot license 6.35%
- Research or academic education 2.68%
The million dollar question was of course: What do people fly?
-
Lockheed Martin Prepar3D v4 30.75%
-
Microsoft FSX 23.46%
-
Laminar Research X-Plane 11 19.58%
-
Dovetail Microsoft FSX: Steam Edition 9.73%
-
Lockheed Martin Prepar3D v3 6.72%
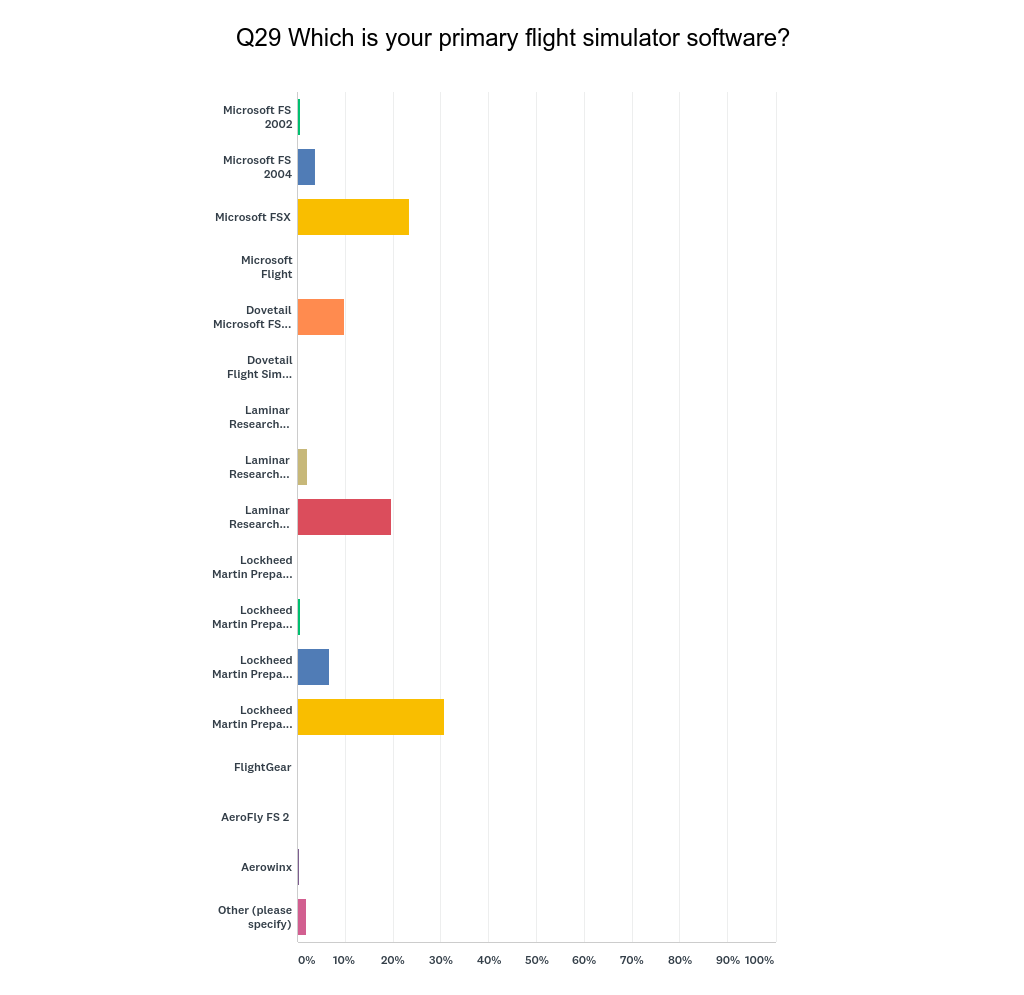
Last year, we did not pose the question as detailed. At that time, the responses were the following:
- Microsoft FSX 60%
- Lockheed Martin Prepar3D 30%
- Laminar Research X-plane 10%
It is clear to see that X-plane has grown in popularity during the last year. Also Lockheed Prepar3D has increased a bit. This becomes very clear looking back at the AVSIM 2013 survey when Microsoft FSX had a strong majority. (Note that Dovetail Microsoft FSX: Steam Edition was released December 18, 2014.)
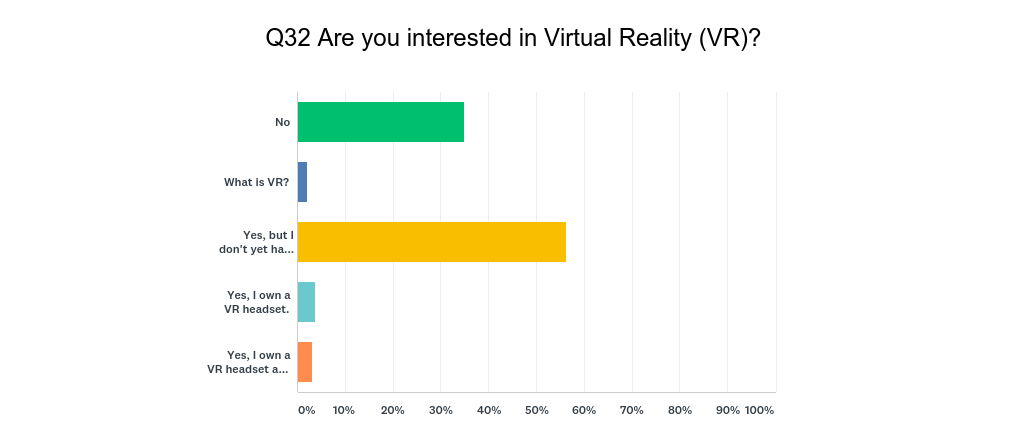
Is Virtual Reality a thing? Well, more than half of the respondents know what VR is, but only 6.77% actually own a VR headset and 3.08% use if for flight simulation.
Consumption Habits
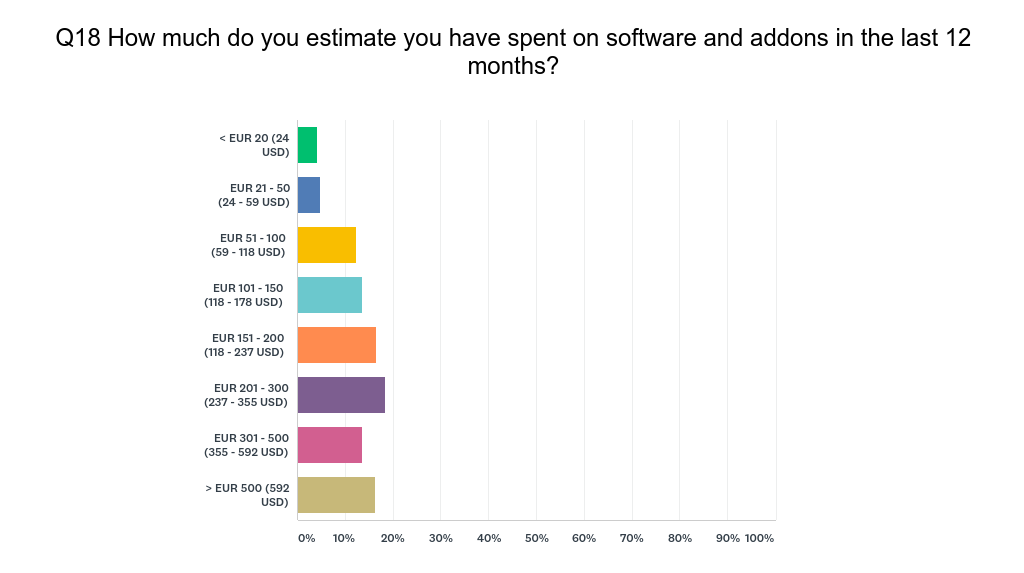
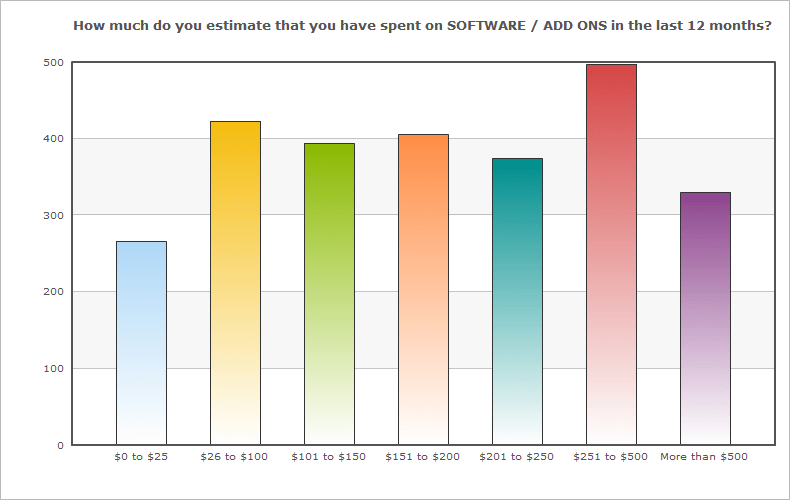
When comparing spending between current 2017 survey and the 2013 AVSIM survey it is hard to tell any trend - mainly because the binning of these histograms are different due to currency. However, there is a notable number of respondents who selected > EUR 200, i.e. > USD 250 per year.
Community
Do people attend conferences? Yes: 20%. No: 80%
The conferences people indicate they will attend in the future are:
- Flight Sim Show, Cosford, Great Britain
- FS Weekend, Lelystadt, The Netherlands
- FlightSimCon, Hartford, CT, USA
42.99% are members of a virtual airline.
45.33% never fly online.
79.01% have not contributed to the flight simulation community. 5.90% have developed some software. 4.30% have modeled or painted livery or scenery. 7.64% admin some flight simulator organization. Many state that they are beta testers or contribute in forums, or help with filing and editing flight plans.
Miscellaneous Product Feedback
As mentioned many times, we use the results from our surveys, focus groups and beta testers to guide the development of our products.
In the 2017 survey we retested chart format familiarity and chart format preference and could confirm that we made the right choice in switching chart providers.
The other questions in this section were, as you may have guessed, intended to determine what to develop next. We asked about your opinion on flight planning software, performance calculators, video content, VFR charts, as well as parts of our current Charts and FMS Data Manager functionality. We also had an open ended question for you to communicate ideas to us about future development. These questions will be subjects for future blog posts.
M eta Analysis
After a survey like this, we also evaluate the survey itself. What can be improved for next time?
We saw an interesting effect between nationality and survey participation.
- United States 23.09% (13.84%)
- United Kingdom 14.21% (7.66%)
- Germany 10.83% (9.31%) …
- Brazil 1.44% (6.38%)
- Russia 1.26% (3.22%)
23.09% of the survey respondents were from United States, but only 13.48% of our user database are from the United States. This means that our users from United States were exceptionally good at participating and voicing their opinion. So was our users from the United Kingdom. Germany did alright too. However, we only got 1.44% participation from Brazil even though 6.38% of our users are from Brazil. We saw a similar disproportionality in participation from France, Spain, Italy and Russia.
It may be that the survey has a language bias and that it favors English speaking countries.
We also noted that the skip logic of the survey platform we chose did not work on all browsers. Therefore, some of you were bothered with repetitive questions, and for this we apologize. We don’t believe that any data was lost due to this though. A respondent took on average 18 minutes to complete the survey.
Last but not least, the survey ended with an application form to join the Navigraph Developer Team. We are happy to announce that we have scheduled hiring interviews as a result of this. The flight simulator network is strong and competent - but this we all knew already, right?
All for now,
The Navigraph Developer Team