

In the new version of Charts Cloud you will see a completely dynamic and interactive enroute chart. We think you will like this, for many reasons, but mainly because it is completely searchable and also automatically declutters as you zoom in and out. We just experimented with the Frankfurt area, and we dare to say it’s good. Really good!
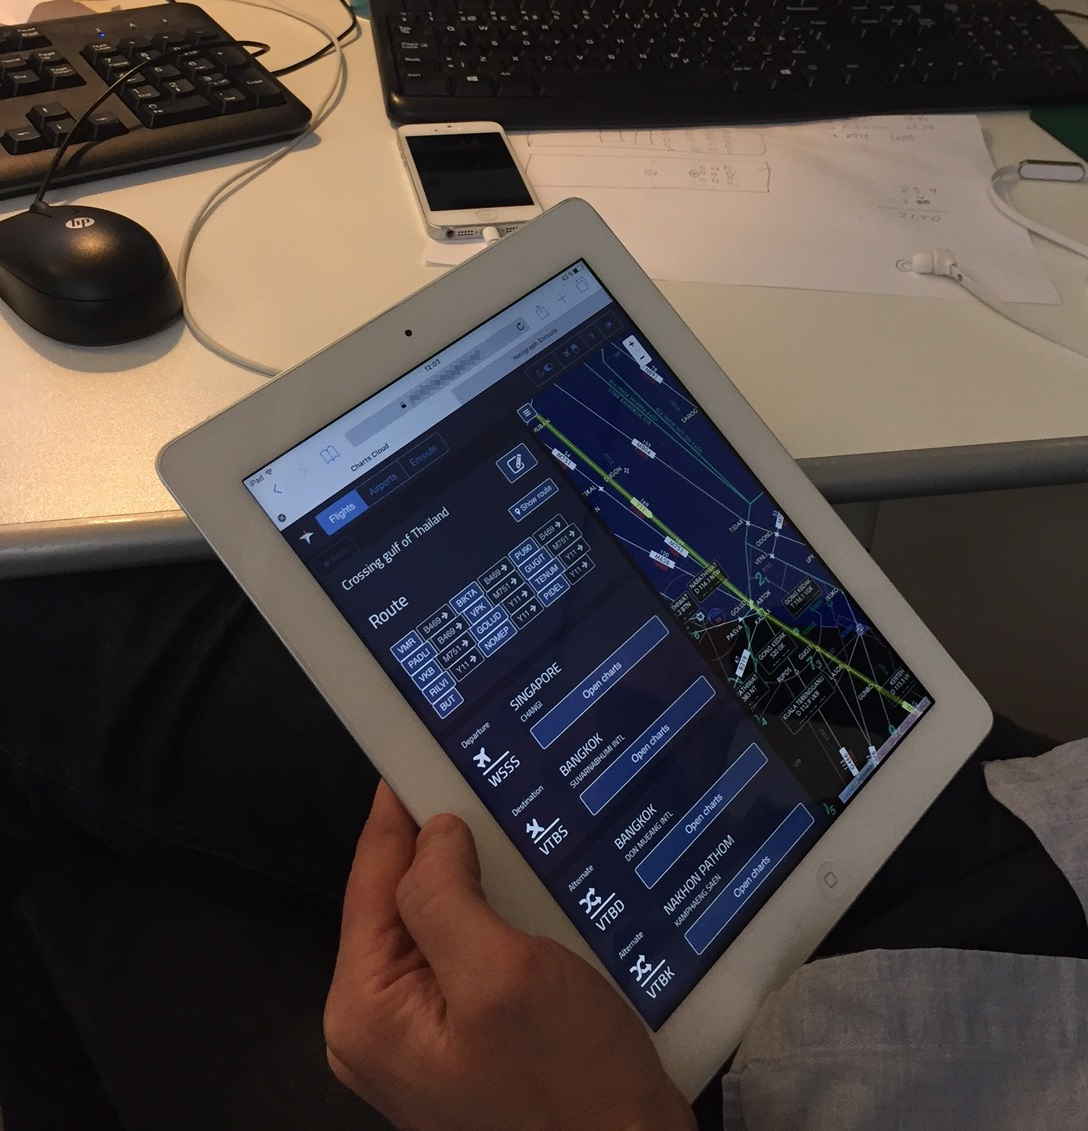
You can also use the enroute charts to display your flights. In the photo below you can see a flight from WSSS to VTBS using the night mode version charts. More importantly - you might notice that this is all shown in a Safari web browser on a rather old iPad. This is Charts Cloud.
As mentioned before, we are also building an iOS app, and Android app, a Desktop version for Windows and Mac; but there is also a completely browser based version of Charts called Charts Cloud. The pun is intended, of course, but we named it this way mainly because it sits entirely in the cloud - on various Amazon AWS services to be more precise. Using the cloud based AWS services gives us speed, low latency, redundancy, and the possibility to have different environments for development and production.
All these benefits brought by the AWS setup made us consider using parts of the Charts Cloud webview in our apps and desktop software as well. Yes, we know what some of you are thinking: The obvious drawback is that we will not support offline for enroute charts mode any longer, but there are plenty of features and benefits that is going to make this tradeoff resonable in the end. Have faith! Others might think that a webview will never feel as responsive as an interface programmed natively. Well, wait and see. This thing is fast!
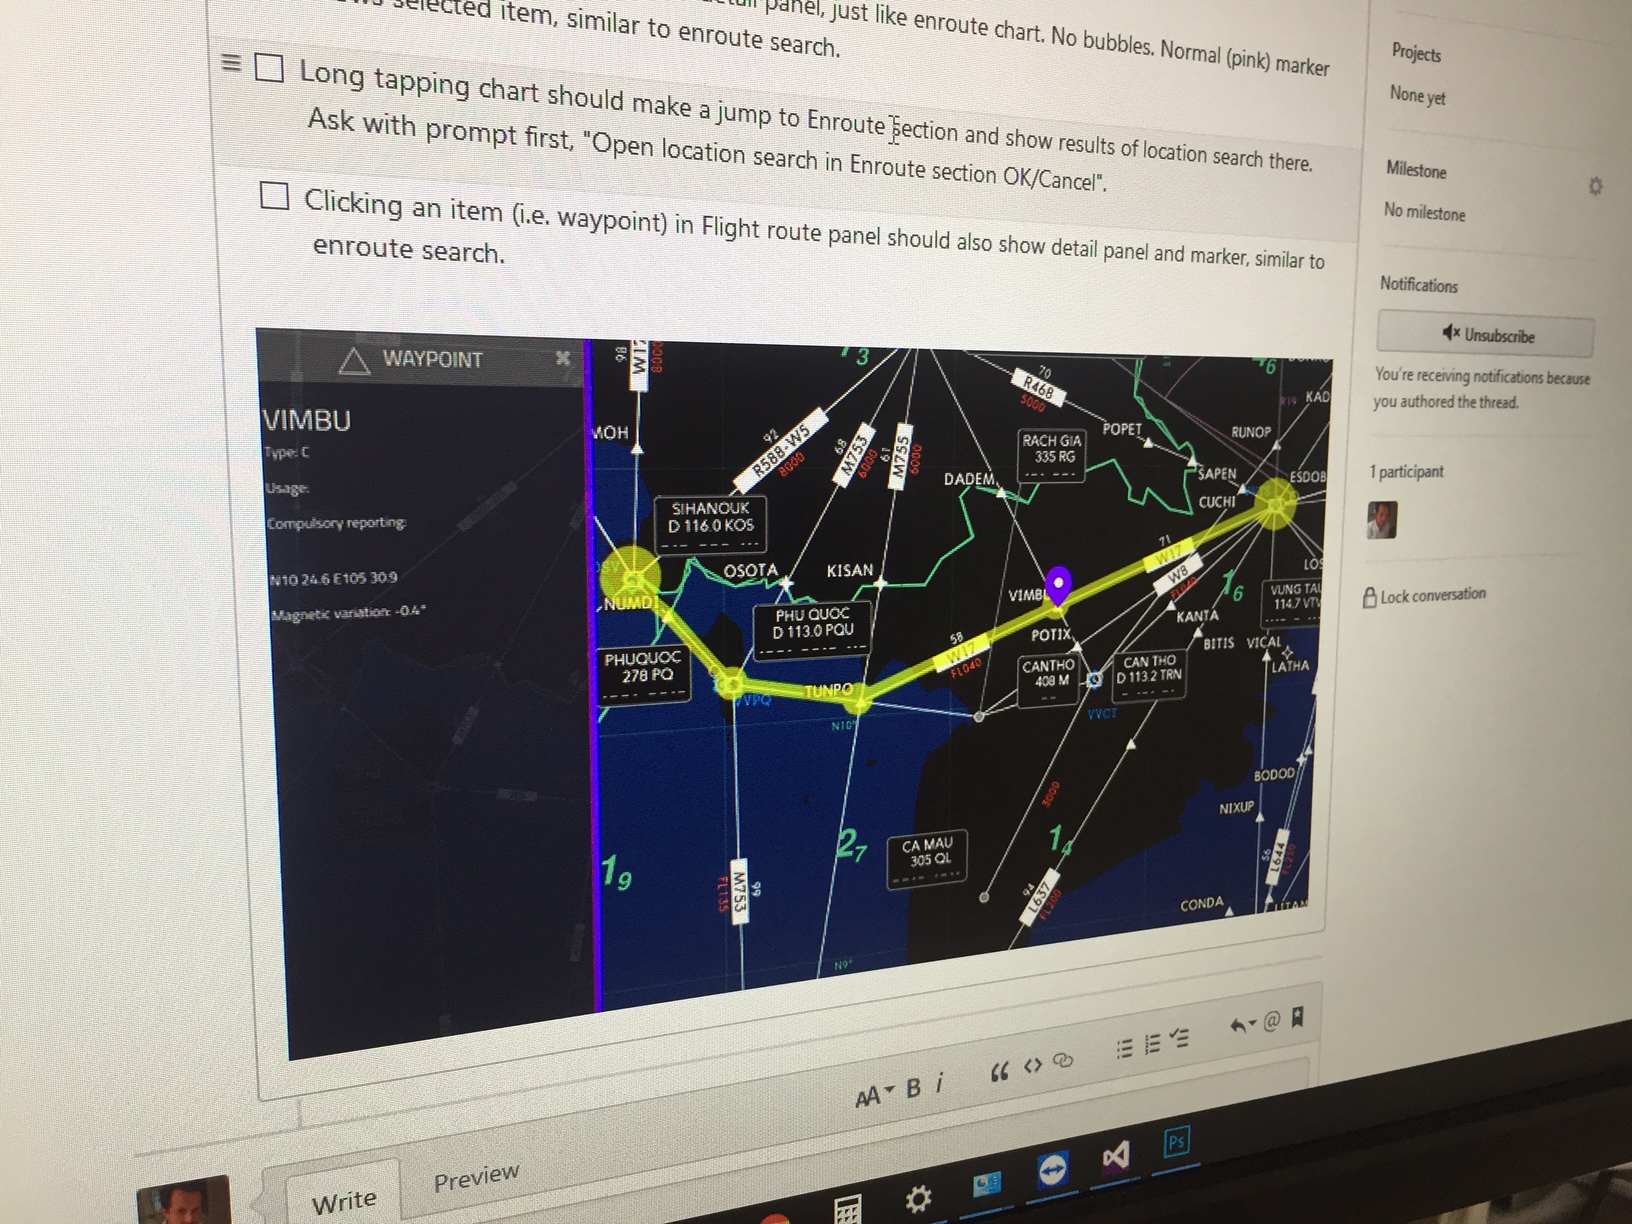
Let’s talk a bit more about the webview which displays the enroute chart. We already mentioned that all objects are now searchable. You can pick them too, simply by tapping the screen. In the image here below, showing a design change proposal in our internal GitHub issue tracker, you can see how the VIMBU waypoint has been selected. The information is displayed as an information panel on the left in the webview. As such, the information panel will be perceived as a part of any native app too.
At the moment you can search and pick:
- Airports
- Waypoints - NDB navaids - VORs - DMEs - VOR/DMEs - TACANs - VOR/TACANS - FIR/UIR sectors - Restricted AirspaceIf you have entered a route, you can also pick:
- Airway segments
Now we have two questions for you, where we really would like your feedback:
1. Are there any objects not listed above which you would like to be able to search and pick?
2. In these objects listed above, which properties are very important to you? What should be displayed in the information panel to the left?
As usual, leave your comments here on the blog below; or in the comments field on Facebook; or write us at dev@navigraph.com.